Metrics#
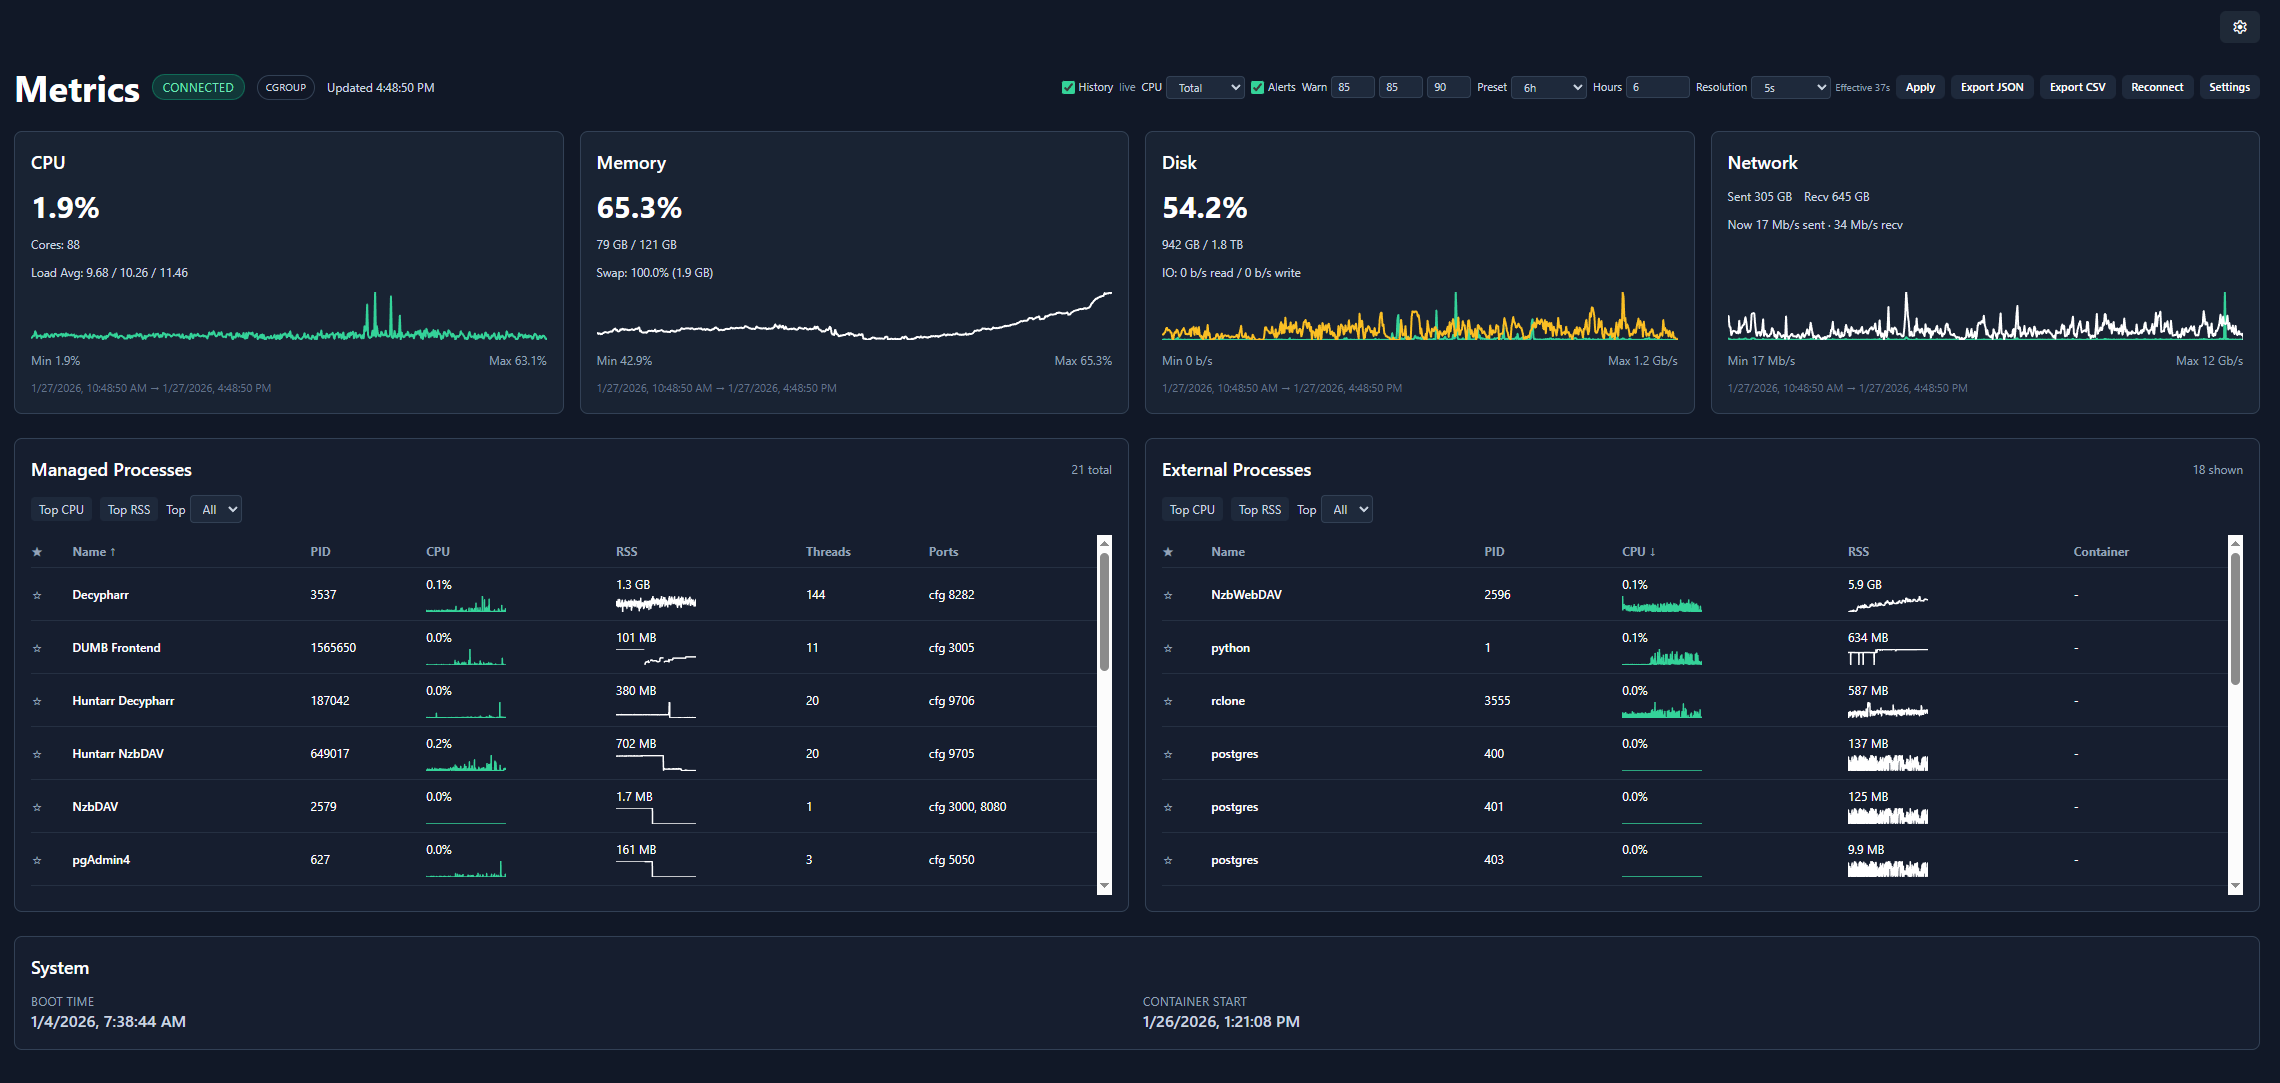
The Metrics page provides real-time and historical system monitoring, displaying CPU, memory, disk, and network usage for the DUMB container.
Overview#
The metrics dashboard shows:
- Real-time gauges - Current resource usage
- Historical charts - Usage trends over time
- Process details - Per-service resource consumption
- System information - Container and host details
Resource monitoring#
CPU usage#
| Metric | Description |
|---|---|
| Usage % | Current CPU utilization |
| Core Count | Available CPU cores |
| Load Average | 1, 5, 15 minute averages |
The CPU gauge shows:
- Green: 0-60%
- Amber: 60-85%
- Red: 85%+
Memory usage#
| Metric | Description |
|---|---|
| Used | Currently allocated memory |
| Available | Free memory for allocation |
| Total | Total system RAM |
| Usage % | Percentage in use |
Swap usage#
| Metric | Description |
|---|---|
| Used | Current swap utilization |
| Total | Total swap space |
| Usage % | Percentage in use |
Swap monitoring
High swap usage may indicate memory pressure. Consider increasing container memory limits.
Disk usage#
| Metric | Description |
|---|---|
| Used | Space consumed |
| Free | Available space |
| Total | Total disk capacity |
| Usage % | Percentage in use |
Network I/O#
| Metric | Description |
|---|---|
| Bytes Sent | Total outbound data |
| Bytes Received | Total inbound data |
| Packets Sent | Outbound packet count |
| Packets Received | Inbound packet count |
Historical charts#
The metrics page displays time-series charts showing resource usage over time:
- Time range - Configurable history window
- Bucket size - Data aggregation interval
- Auto-refresh - Continuous updates via WebSocket
Chart controls#
| Control | Function |
|---|---|
| Zoom | Scroll to zoom in/out |
| Pan | Click and drag to move |
| Reset | Double-click to reset view |
Per-process metrics#
View resource usage for individual services:
| Column | Description |
|---|---|
| Process | Service name |
| PID | Process ID |
| CPU % | CPU utilization |
| Memory % | RAM utilization |
| Memory RSS | Resident set size |
Sort by any column to identify resource-intensive services.
System information#
Container details#
| Info | Description |
|---|---|
| Boot Time | When the container started |
| Uptime | Time since boot |
| Platform | Operating system |
cgroup awareness#
DUMB automatically detects whether it's running in a cgroup-limited environment (Docker/Kubernetes) and reports metrics accordingly:
- cgroup mode - Reports container limits, not host resources
- Host mode - Reports full system resources
WebSocket connection#
Metrics are streamed in real-time via WebSocket:
| Status | Indicator |
|---|---|
| Connected | Live updates active |
| Connecting | Establishing connection |
| Disconnected | No live updates |
The frontend automatically reconnects if the connection drops.
Configuration#
Update interval#
Configure how frequently metrics are updated:
| Setting | Default | Range |
|---|---|---|
| Interval | 2 seconds | 0.5-10 seconds |
Lower intervals provide more responsive updates but increase network traffic.
History settings#
| Setting | Default | Description |
|---|---|---|
| Retention | 7 days | How long to keep history |
| Bucket Size | 5 seconds | Aggregation interval |
| Max File Size | 50 MB | Per-file storage limit |
Alert thresholds#
Configure when alerts appear on the dashboard:
| Resource | Default | Setting Location |
|---|---|---|
| CPU | 85% | Settings Preferences |
| Memory | 85% | Settings Preferences |
| Disk | 90% | Settings Preferences |
Alerts appear as banners at the top of the dashboard when thresholds are exceeded.
API access#
Metrics are also available via the REST API:
# Current metrics snapshot
curl http://localhost:8000/api/metrics

# Historical metrics
curl http://localhost:8000/api/metrics/history?start=2025-01-01&end=2025-01-15
See the WebSocket API documentation for real-time streaming.
Troubleshooting#
Metrics not updating#
- Check WebSocket connection status
- Verify browser supports WebSocket
- Check for network/firewall issues
High memory usage#
- Review per-process metrics to identify heavy services
- Consider disabling unused services
- Increase container memory limits
Disk filling up#
- Check log file sizes
- Review metrics retention settings
- Clear old data if needed
Related pages#
- Dashboard - Service monitoring
- WebSocket API - Real-time data streaming
- Settings - Alert configuration