Dashboard#
The dashboard is the main page of the DUMB Frontend, providing an at-a-glance view of all your services with real-time status updates and quick controls.
Overview#
The dashboard displays service cards for each configured service, showing:
- Service name and status
- Health indicator
- Auto-restart badge
- Quick action buttons
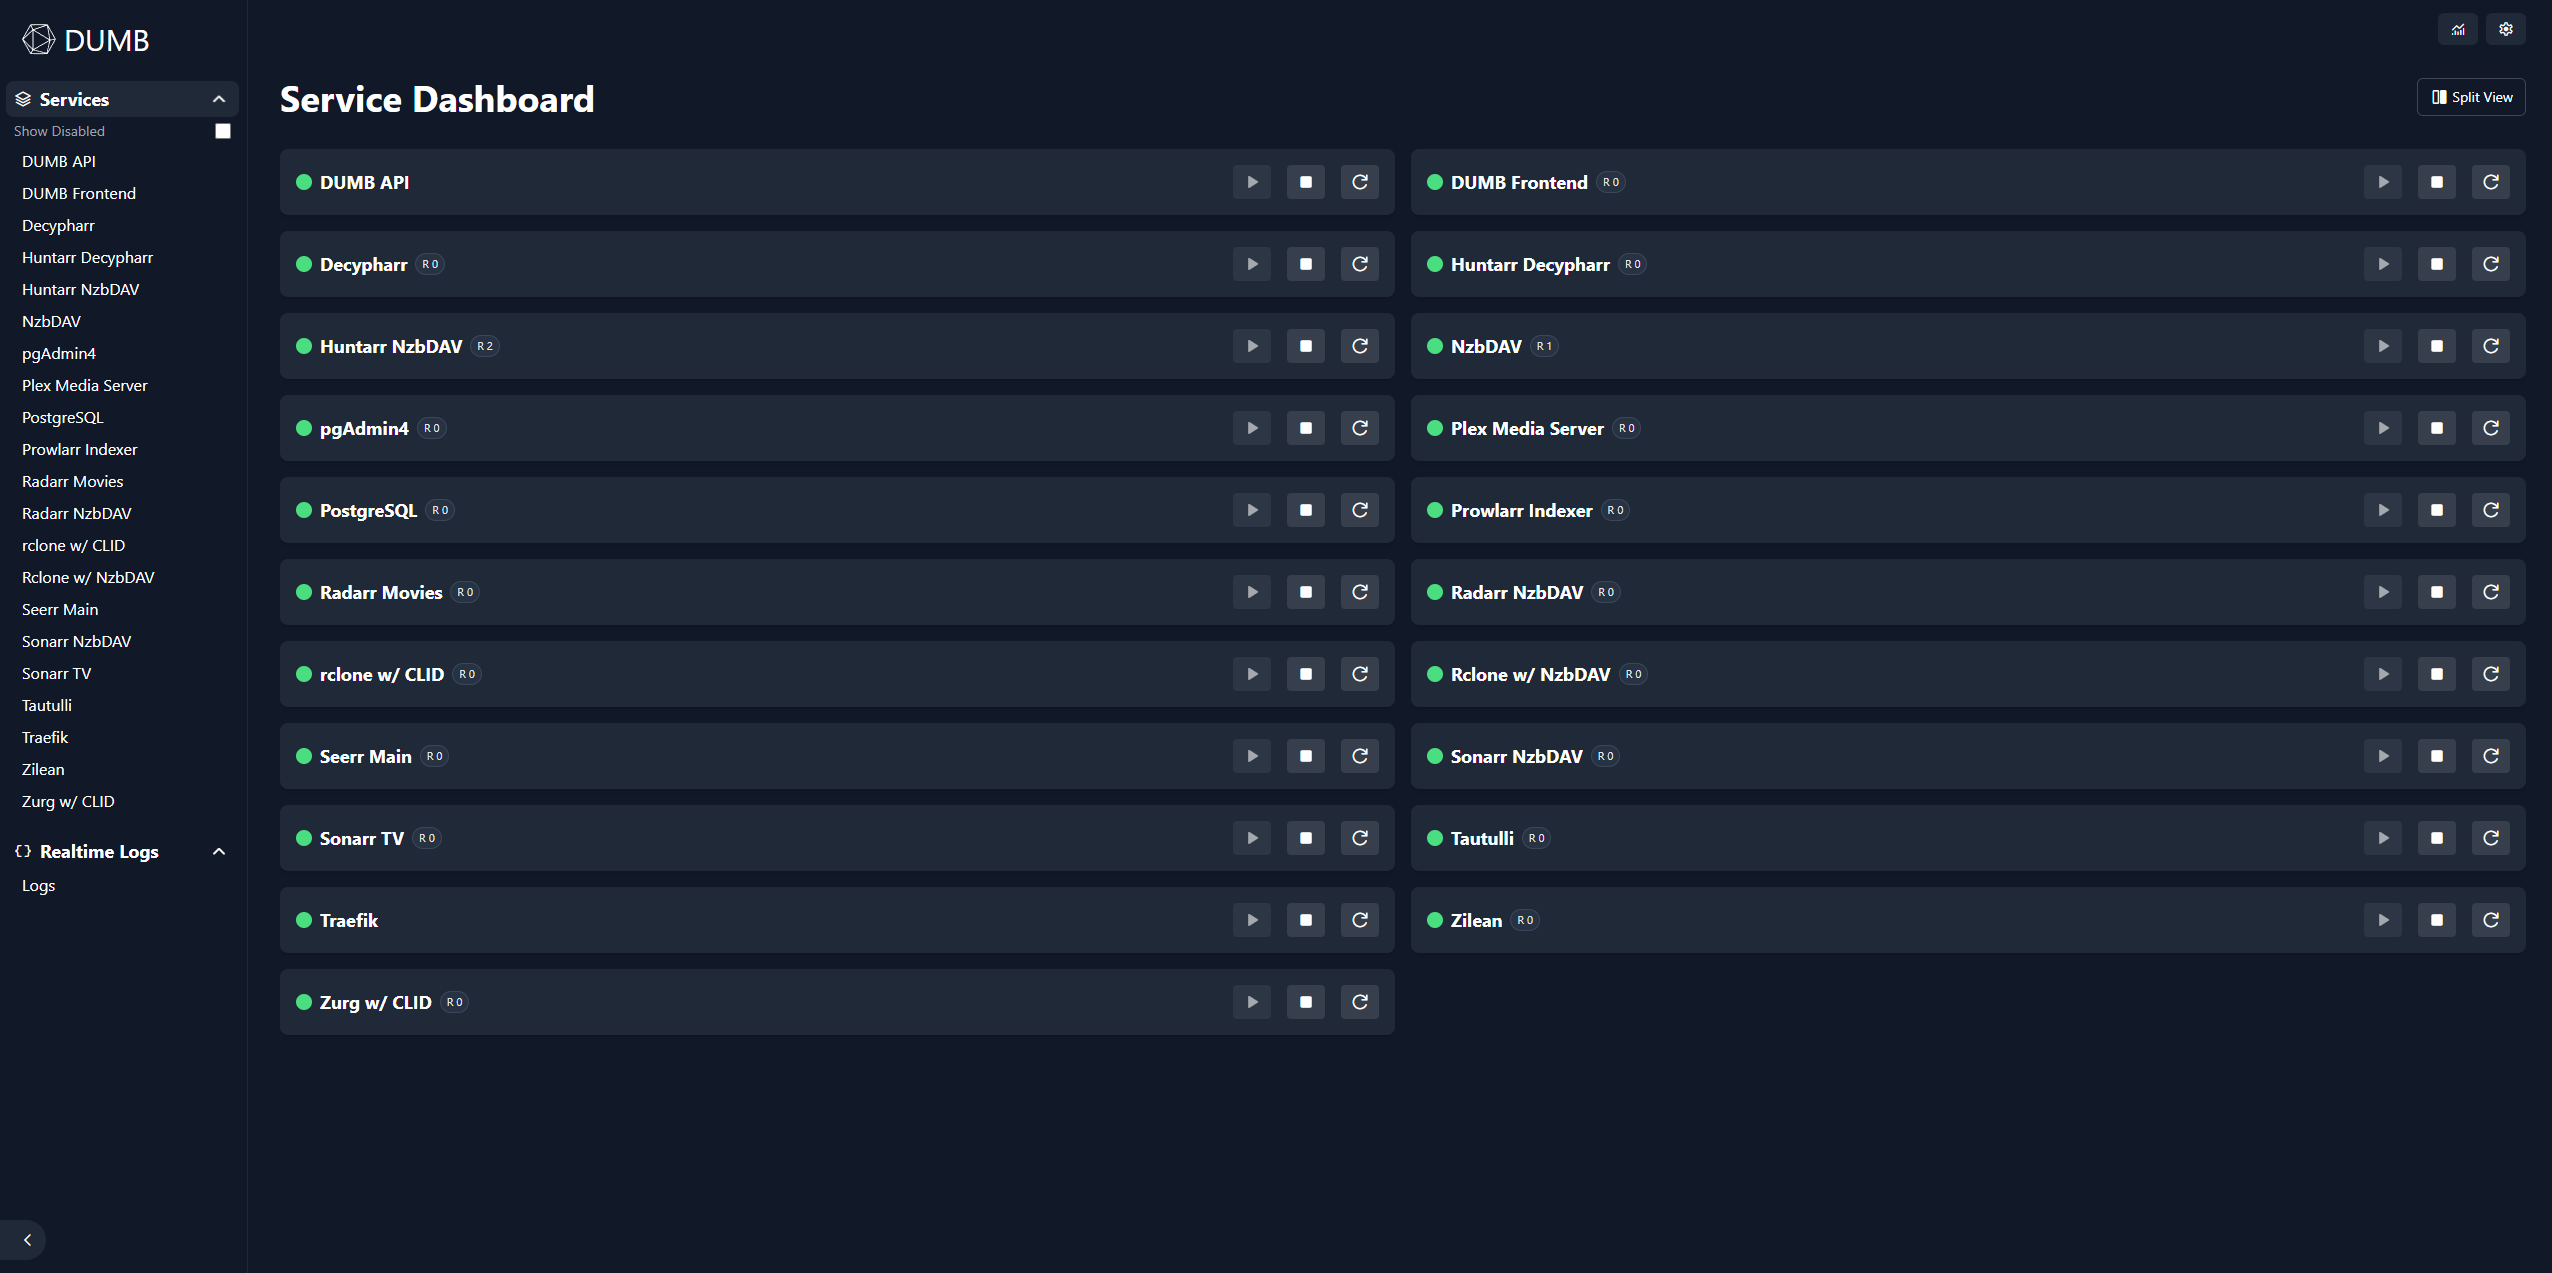
Service cards#
Each service is represented by a card with the following elements:
Status indicator#
| Color | Status |
|---|---|
| Green | Running and healthy |
| Red | Stopped |
| Amber | Running but unhealthy |
| Gray | Unknown status |
Health badge#
When a service has health checks enabled, you'll see:
- Healthy - Service is responding correctly
- Unhealthy - Service failed health check (with reason on hover)
Auto-restart badge#
If auto-restart is enabled for a service:
- Shows restart count (e.g., "Restarts: 2")
- Indicates the auto-restart feature is active
Resource badges (Geek Mode)#
With Geek Mode enabled, each service card shows live resource badges:
- CPU% - Color-coded by usage (green < 50%, amber < 80%, red >= 80%)
- Memory RSS - Current resident memory usage
Metrics are polled every 5 seconds while Geek Mode is active and stop automatically when disabled.
Quick actions#
Each service card provides action buttons:
| Button | Action | Description |
|---|---|---|
| Start | Start a stopped service | |
| Stop | Stop a running service | |
| Restart | Restart a running service |
Tooltips
Hover over action buttons to see what each will do.
Service detail navigation#
Click anywhere on a service card (except the action buttons) to open its service page. For a full breakdown of service-page controls (config editors, logs, auto-restart overrides, and embedded UIs), see Service pages.
Real-time updates#
The dashboard automatically receives updates via WebSocket:
- Status changes appear immediately
- Health check results update in real-time
- No manual refresh needed
The connection status is shown in the header area. If disconnected, the frontend will automatically attempt to reconnect.
Toolbar and log viewer#
The toolbar provides quick access to service settings and logs.
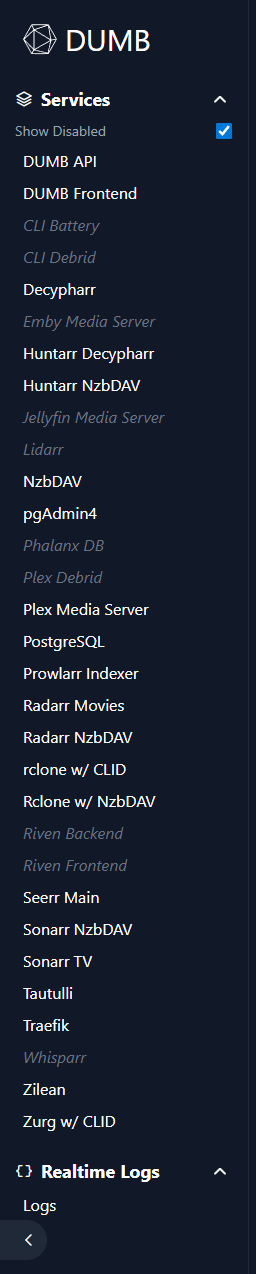
From here you can:
- Show disabled services
- Jump to a service’s logs or config
- Open the main DUMB config editor
Real-time logs#
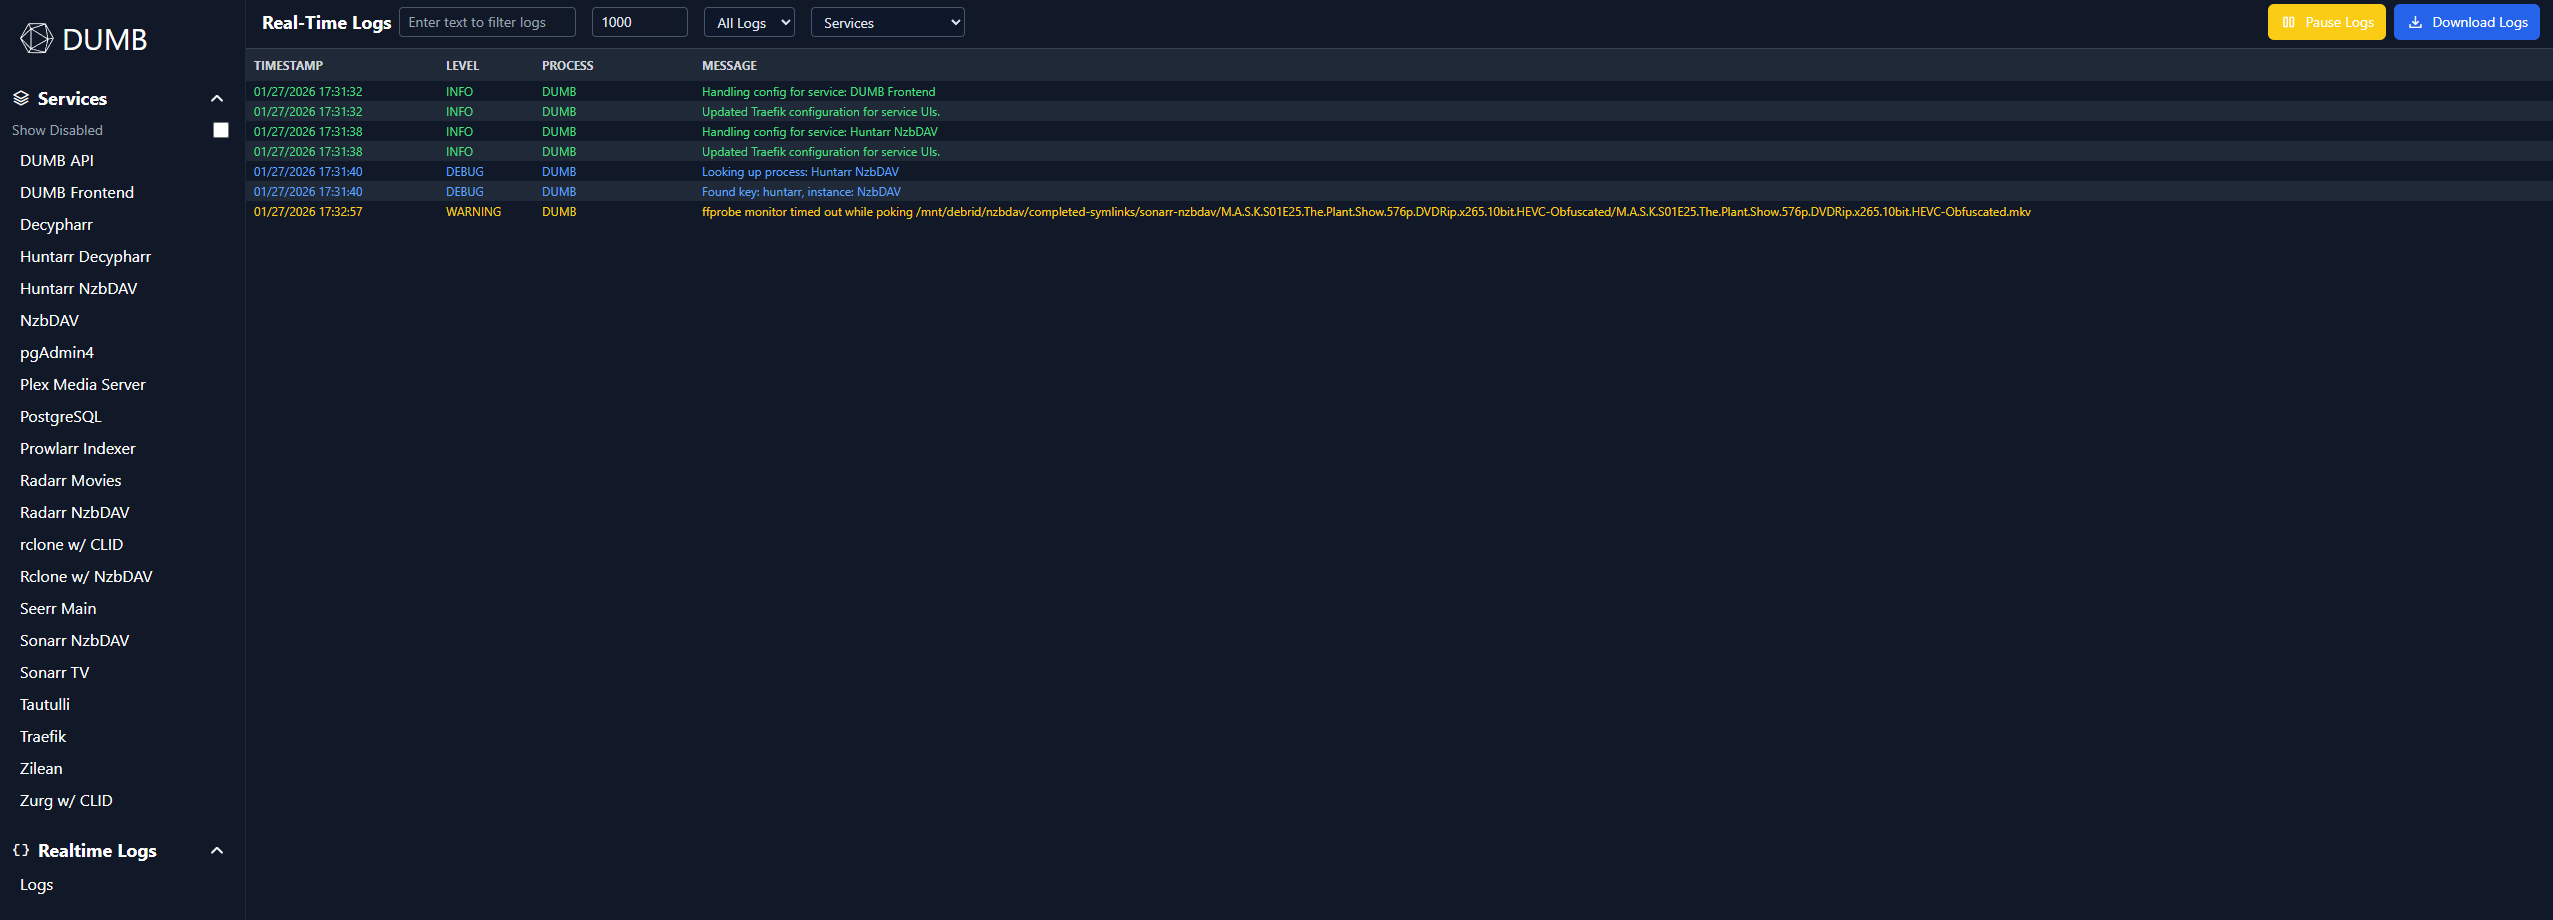
The log viewer supports:
- Filtering by text or log level
- Selecting process names
- Pausing/resuming the stream
- Downloading log snapshots (
DMB_logs.txt)
Filtering and organization#
Services are displayed in a grid layout, organized by:
- Enabled services first - Active services appear prominently
- Alphabetical order - Within each group
Tile reordering#
You can reorder dashboard service tiles with drag-and-drop.
- Drag a tile (or use the drag handle) to move it
- Other tiles shift in real time while you drag
- The same order is applied to the Services list in the sidebar
Order is persisted in dumb_config.json under:
dumb.ui.sidebar.service_order
Mobile and touch behavior#
On mobile, touch reordering is protected by a lock toggle to prevent accidental tile moves while scrolling:
- Reorder Off (default): touch scrolling only, no tile movement
- Reorder On: drag-handle touch reordering is enabled
System alerts#
When system resources are critically high, alerts appear at the top of the dashboard:
| Alert | Trigger |
|---|---|
| CPU Warning | CPU usage exceeds threshold (default 85%) |
| Memory Warning | Memory usage exceeds threshold (default 85%) |
| Disk Warning | Disk usage exceeds threshold (default 90%) |
Configure alert thresholds in the Settings page.
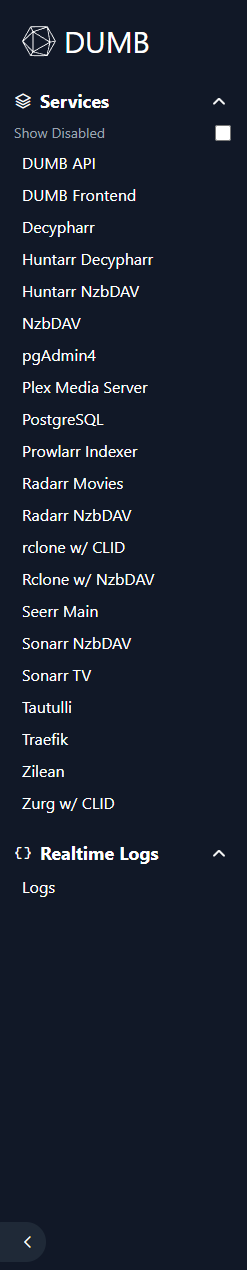
Sidebar navigation#
The sidebar provides quick access to:
- Home - Return to dashboard
- Settings - Configuration and preferences
- Metrics - System monitoring
- Onboarding - Re-run setup wizard
The Services section follows the same persisted service_order used by dashboard tiles.
Related pages#
- Service Management - Detailed service controls
- Metrics - System resource monitoring
- Settings - Dashboard preferences